先前介紹我自己做現股當沖的頁面時,有提到我會透過一些自訂的指標來檢視我的觀察名單,其中一個自訂指標是個股儀表板。這個指標是把一些常在的買進訊號標在K線上,讓我了解目前個股K線是不是有出現多個買進訊號,今天我想試著把這樣的概念轉換成選股的腳本,用一個腳本來挑出最近三日內有出現多個買進訊號的股票。
首先還是要先介紹一下個股儀表板這個自訂指標,下面這個連結裡有完整的介紹
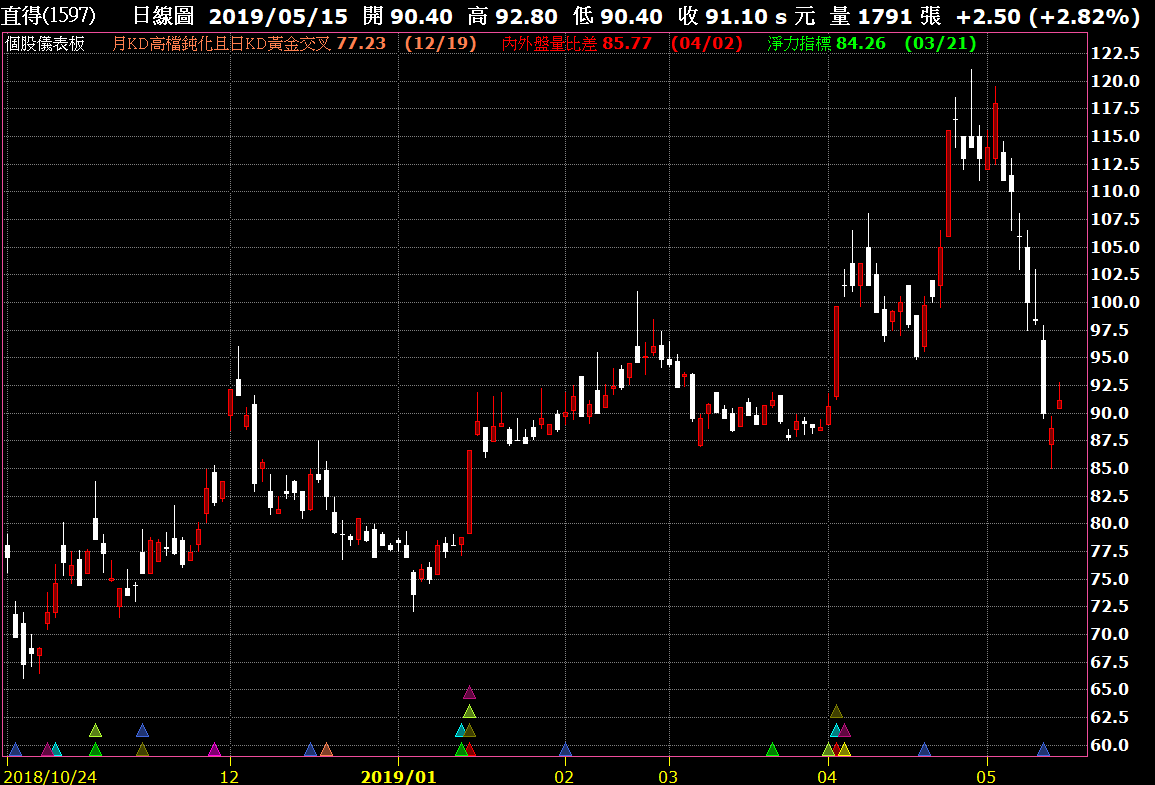
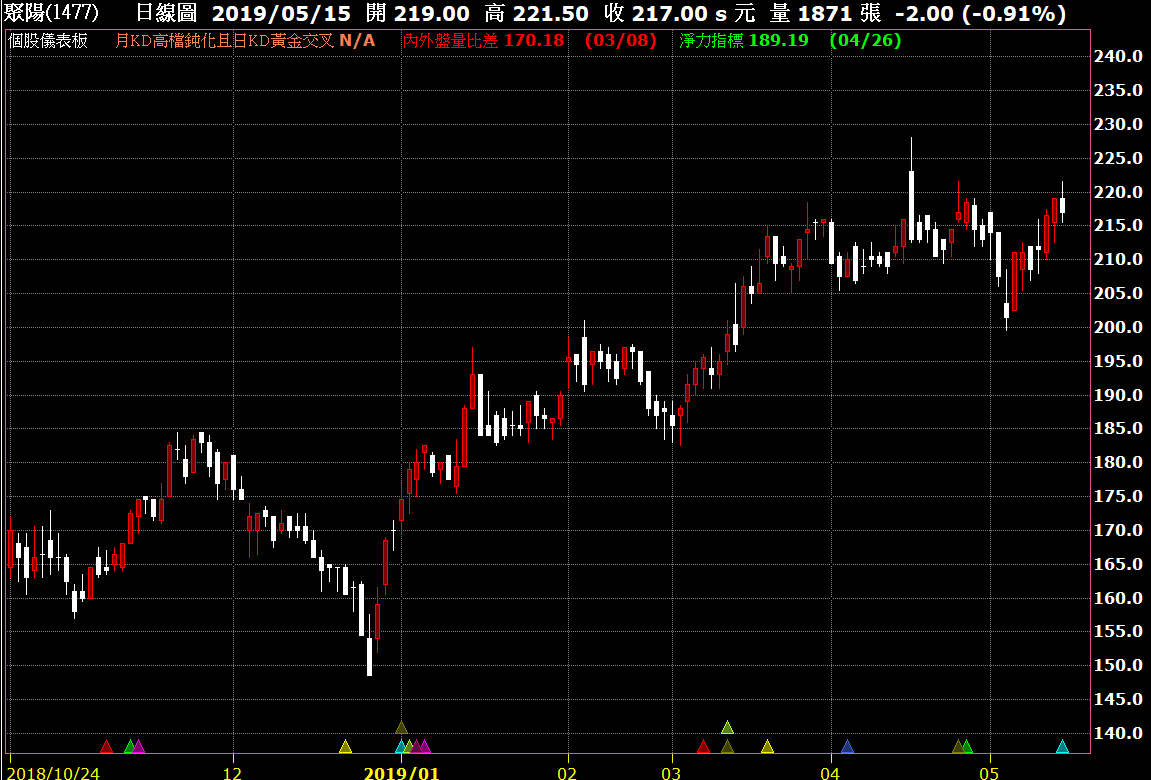
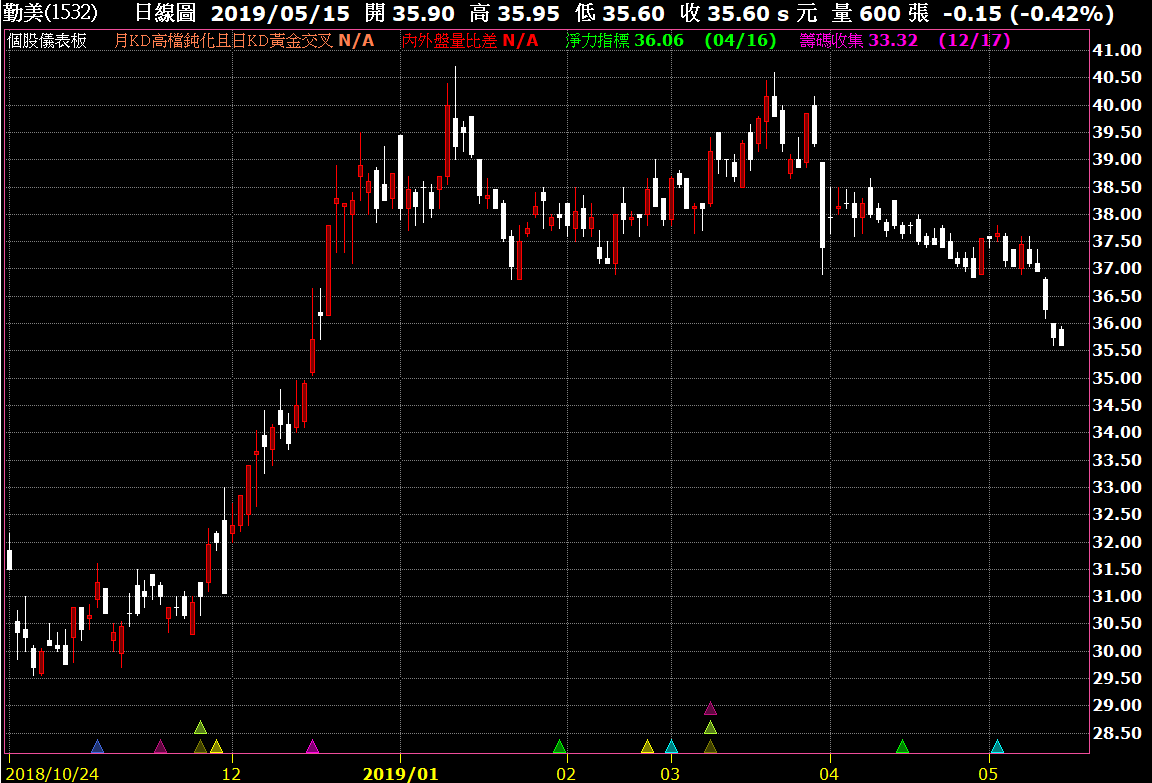
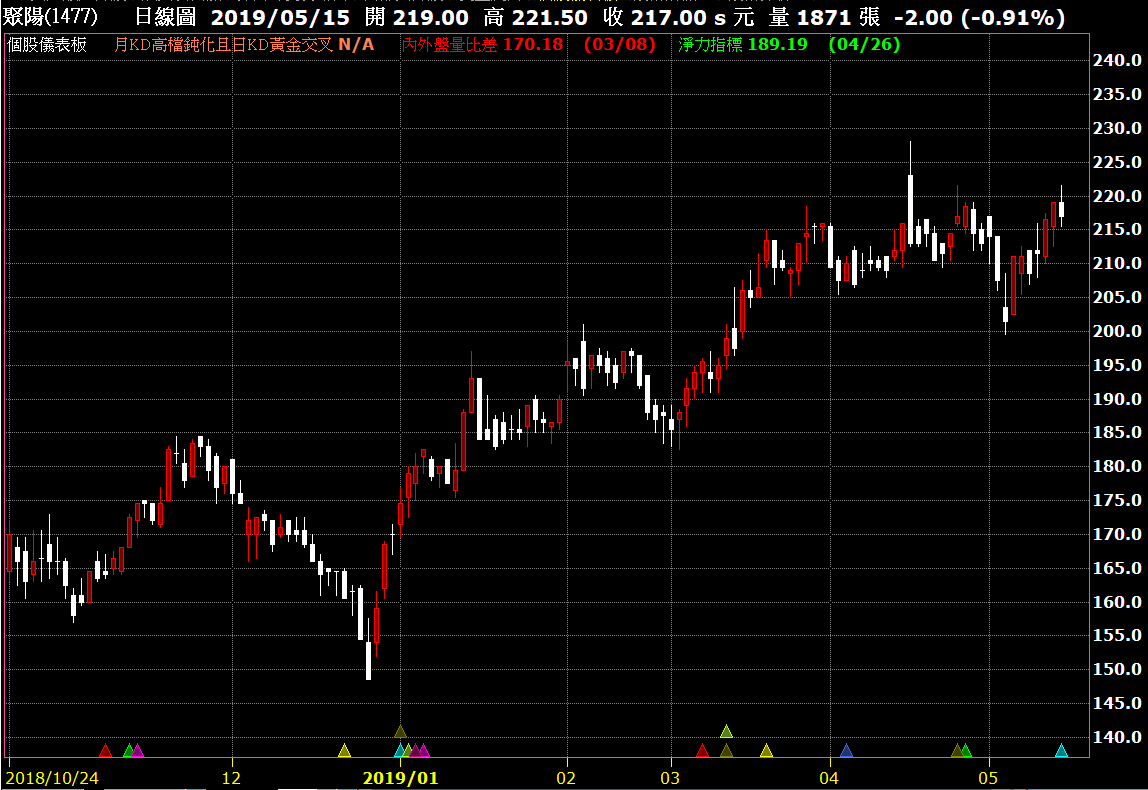
用這個方法,個股儀表板會如下面幾個圖裡呈現的樣子
從上面幾個圖我們會發現,當只有一個買進訊號時,股票後市未必就會漲,但如果是同一天有多個買進訊號,或三天內密集出現多個買進訊號,那短線上漲的機率就大很多。
過去我們最早的程式寫法是單一條件觸發就進場,後來我們用and 及or來處理多條件一起考量的思考方式,從上面幾個圖來看,我們接下來必須處理的是近幾天但不見得是同一天多個條件觸發的情況。
於是,我寫了以下的一個樣本腳本來處理這件事
我用的腳本
var:count(0);
count=0;

//===========法人同步買超====================
variable: v1(0),v2(0),v3(0),c1(0);
v1=Getfield("外資買賣超");
v2=Getfield("投信買賣超");
v3=Getfield("自營商買賣超");

c1= barslast(minlist2(v1,v2,v3)>100);
if c1=0 and c1[1]>20
then count=count+1;

//===========多頭起漲前的籌碼收集================
variable:c2(0);
value1=GetField("分公司買進家數");
value2=GetField("分公司賣出家數");
value3=value2-value1;
value4=countif(value3>20,10);
c2=barslast(value4>6 );
if c2=0 and c2[1]>20
then count= count+1;

//============內外盤量比差====================
variable:c3(0);
value6=GetField("內盤量");//單位:元
value7=GetField("外盤量");//單位:元
if volume<>0 then begin
value8=value7/volume*100;//外盤量比
value9=value6/volume*100;//內盤量比
end;
value10=average(value8,5);
value11=average(value9,5);
value7=value10-value11+5;
c3=barslast(value7 crosses over 0);
if c3=0 and c3[1]>20
then count=count+1;

//===========淨力指標==============
variable:c4(0);
input:period2(10,"長期參數");

value12=summation(high-close,period2);//上檔賣壓
value13=summation(close-open,period2); //多空實績
value14=summation(close-low,period2);//下檔支撐
value15=summation(open-close[1],period2);//隔夜力道
if close<>0
then
value16=(value13+value14+value15-value12)/close*100;

c4=barslast( value16 crosses over -4);
if c4=0 and c4[1]>20
then count=count+1;

//==========日KD黃金交叉================

input: Length_D(9, "日KD期間");
input: Length_M(5, "周KD期間");
variable:rsv_d(0),kk_d(0),dd_d(0),c5(0);

stochastic(Length_D, 3, 3, rsv_d, kk_d, dd_d);

c5=barslast(kk_d crosses over dd_d);
if c5=0 and c5[1]>20
then count=count+1;

//========DIF-MACD翻正=============
input: FastLength(12), SlowLength(26), MACDLength(9);
variable: difValue(0), macdValue(0), oscValue(0);
MACD(weightedclose(), FastLength, SlowLength, MACDLength, difValue, macdValue, oscValue);
variable:c6(0);
c6=barslast(oscValue Crosses Above 0);
if c6=0 and c6[1]>20
then count=count+1;

//============主力多日買超==============
var:v7(0),c7(0);
v7=GetField("主力買賣超張數","D");
c7=barslast(trueall(v7>500,3));
if c7=0 and c7[1]>20
then count=count+1;

//=========總成交次數================
variable: t1(0),mat1(0),c8(0);
t1=GetField("總成交次數","D");
mat1=average(t1,20)*1.5;
c8=barslast(t1 crosses over mat1 and close>close[1]);
if c8=0 and c8[1]>20
then count=count+1;

//========
var:v9(0),c9(0);
v9=GetField("綜合前十大券商買賣超張數","D");
c9=barslast(trueall(v9>300,3));
if c9=0 and c9[1]>20
then count=count+1;

//============開盤委買================
variable:b1(0),mab1(0),c10(0);
b1=GetField("主力買張");
mab1=average(b1,10);
c10=barslast(b1 crosses over mab1);
if c10=0 and c10[1]>10
then count=count+1;

if count>2 or count+count[1]>3 or count+count[1]+count[2]>5 then ret=1;
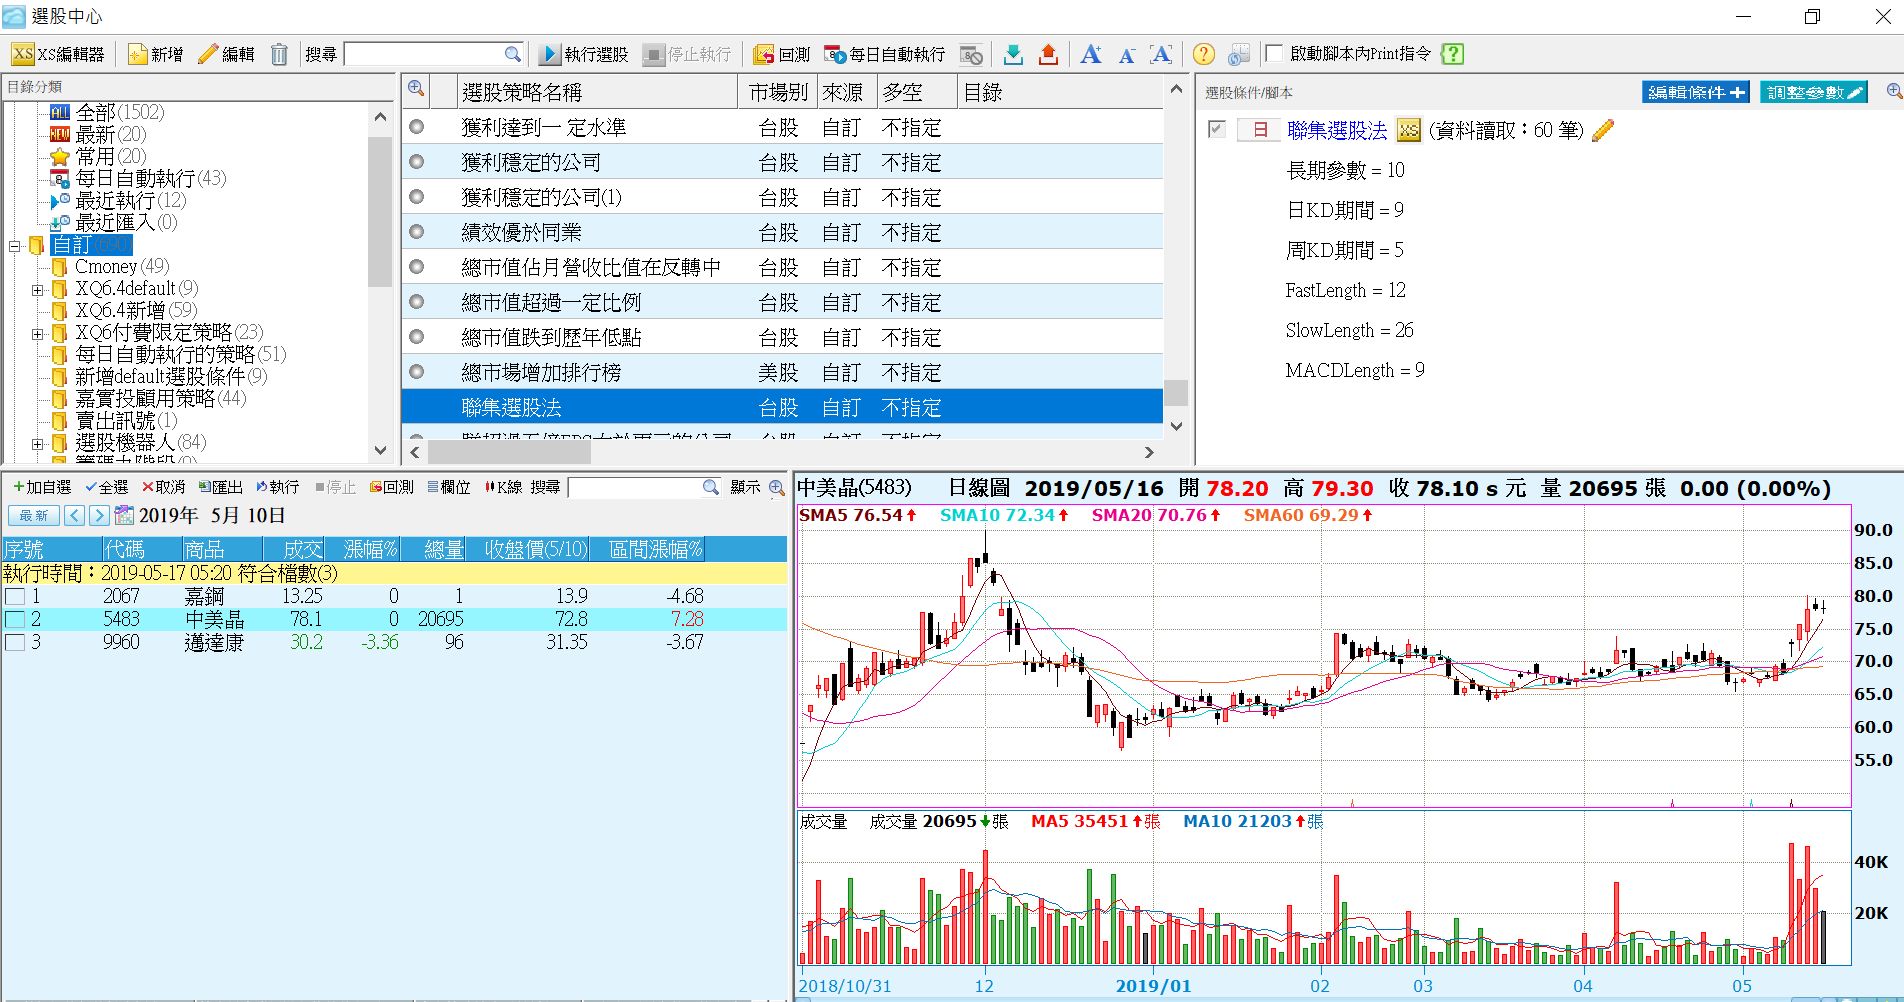
下面幾張圖是近幾天上述腳本觸發的標的,感覺是有參考的價值。
目前由於指標與警示與選股三個功能裡,能夠使用的欄位不一樣,所以我無法把個股儀表板裡的條件照搬到警示及選股,但透過上述的寫法,我可以每天挑到一些近三日密集出現多個買進訊號的股票,接下來再把這些股票放到觀察名單中,在盤中用預估量暴增的腳本去跑策略雷達,這樣就可以找到那些剛剛冒出頭的股票,在今天盤中表現依然很不錯的個股。

