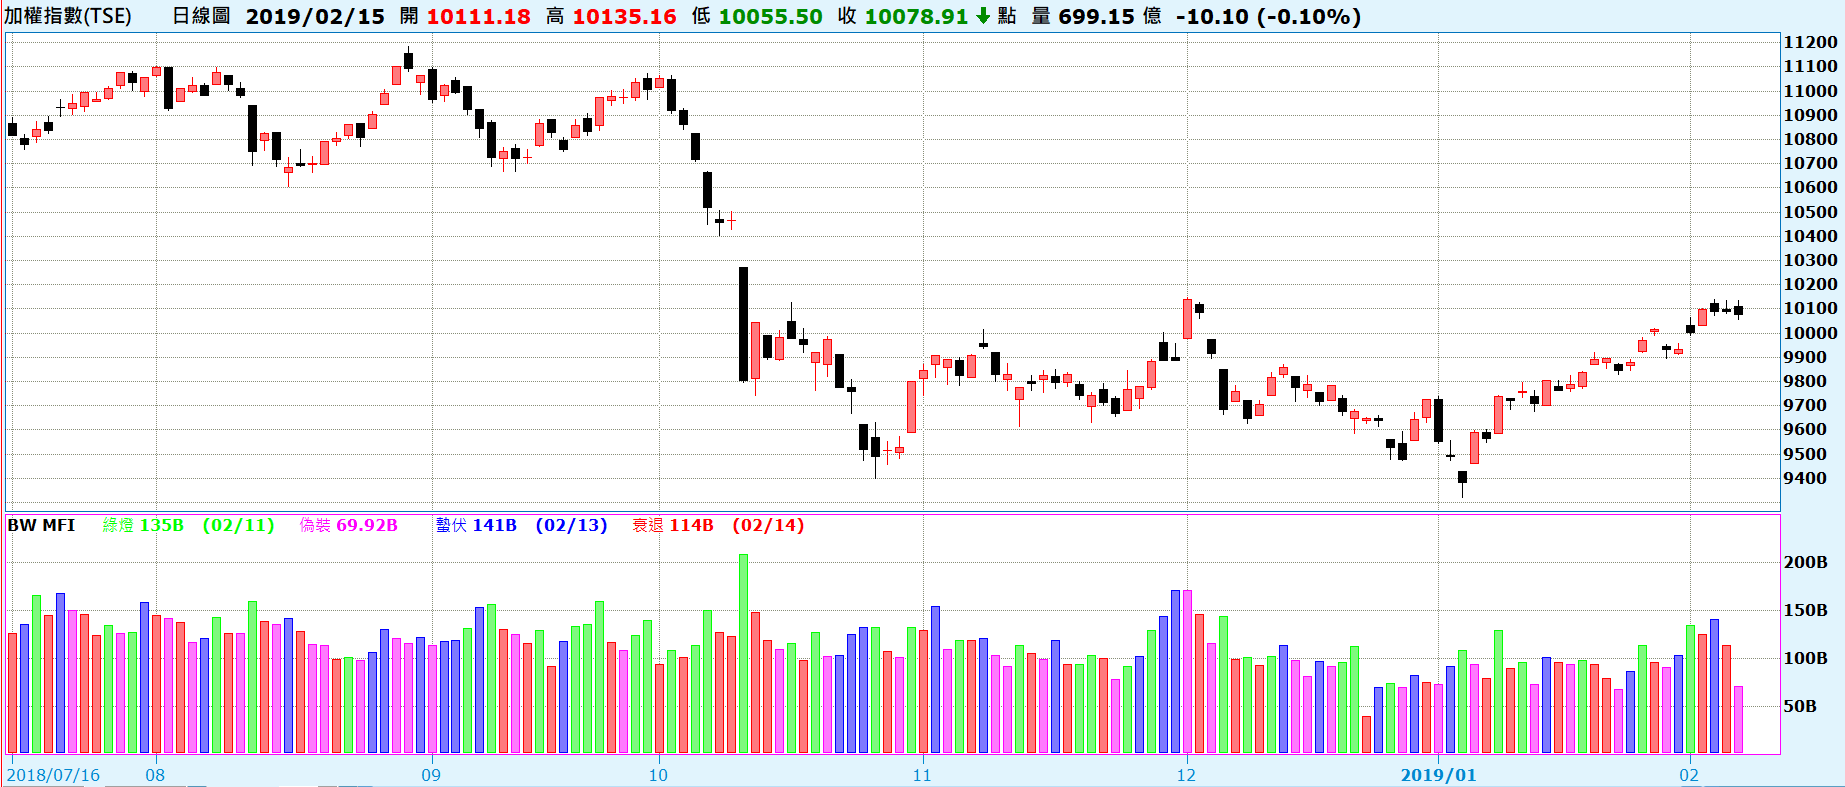
Market Facilitation Index (BW MFI) 市場便利指標是由 Dr. Bill Williams所發明的
這個指標必須搭配成交量來一起看 :
+交易量/+MFI 綠燈(Green)
-交易量/-MFI 衰退(Fade)
-交易量/+MFI 偽裝(Fake)
+交易量/-MFI 蟄伏(Squat)
市場便利指標運用時會與成交量一起使用 : 市場便利指標增加,交易量增加 (Green)。
這一點表明 :
- 進入市場的交易人員的數量增加。(交易量增加)
- 新的交易人員會隨著柱圖的發展趨勢入市。(例如,移動的開始和速度的加快)
市場便利指標的回落和交易量的下降 (Fade),表明市場的交易人對該市場不在感到有任何的興趣。
市場便利指標的增加,但交易量下降 (Fake)。最有可能的就是,市場並不受到來自客戶交易量的支援,價格隨著“底樓”交易人員的遊資而變化(經濟人和交易人)
市場便利指標的下跌,但是交易量的增加 (Squat)。存在牛力和熊力之間的鬥爭。主要特徵為大量的買進和大量的賣出。 但是價格沒有重大的變化,因為兩股勢力比較相當。競爭的其中一方(買家或賣家)將會最終贏得這次鬥爭的勝利。 通常,柱形的停滯讓你知道是否這個柱形決定了市場趨勢的連續性,或這個柱形終止了市場趨勢。Bill Williams 稱之為“Squat”。
腳本的寫法
1{ 2指標說明 3Market Facilitation Index 4} 5 6if volume <> 0 then 7 value1=(high-low)/volume; 8if value1>value1[1] and volume>volume[1] then begin 9 plot1(volume,"綠燈"); 10 noplot(2); 11 noplot(3); 12 noplot(4); 13end; 14if value1>value1[1] and volume<=volume[1] then begin 15 plot2(volume,"偽裝"); 16 noplot(1); 17 noplot(3); 18 noplot(4); 19end; 20if value1<=value1[1] and volume>volume[1] then begin 21 plot3(volume,"蟄伏"); 22 noplot(1); 23 noplot(2); 24 noplot(4); 25end; 26if value1<=value1[1] and volume<=volume[1] then begin 27 plot4(volume,"衰退"); 28 noplot(1); 29 noplot(2); 30 noplot(3); 31end;
參考的圖形

